
പ്രമാണം:South Africa 2011 dominant language map.svg

ഈ SVG പ്രമാണത്തിന്റെ PNG പ്രിവ്യൂവിന്റെ വലിപ്പം: 684 × 599 പിക്സലുകൾ. മറ്റ് റെസലൂഷനുകൾ: 274 × 240 പിക്സലുകൾ | 548 × 480 പിക്സലുകൾ | 876 × 768 പിക്സലുകൾ | 1,168 × 1,024 പിക്സലുകൾ | 2,337 × 2,048 പിക്സലുകൾ | 809 × 709 പിക്സലുകൾ.
പൂർണ്ണ വലിപ്പം (എസ്.വി.ജി. പ്രമാണം, നാമമാത്രമായ 809 × 709 പിക്സലുകൾ, പ്രമാണത്തിന്റെ വലിപ്പം: 798 കെ.ബി.)
| ഈ പ്രമാണം വിക്കിമീഡിയ കോമൺസിൽ നിന്നുള്ളതാണ്. പ്രമാണത്തെക്കുറിച്ചുള്ള വിവരണം താഴെ കൊടുത്തിരിക്കുന്നു.
|
ചുരുക്കം
| വിവരണം |
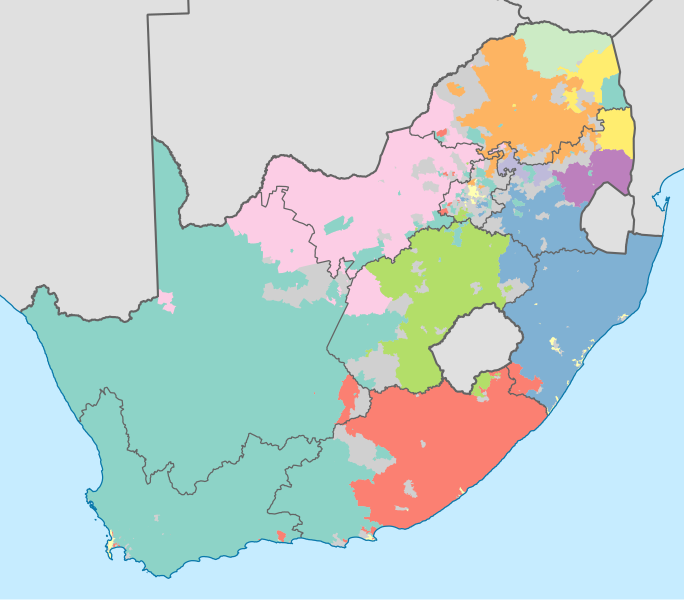
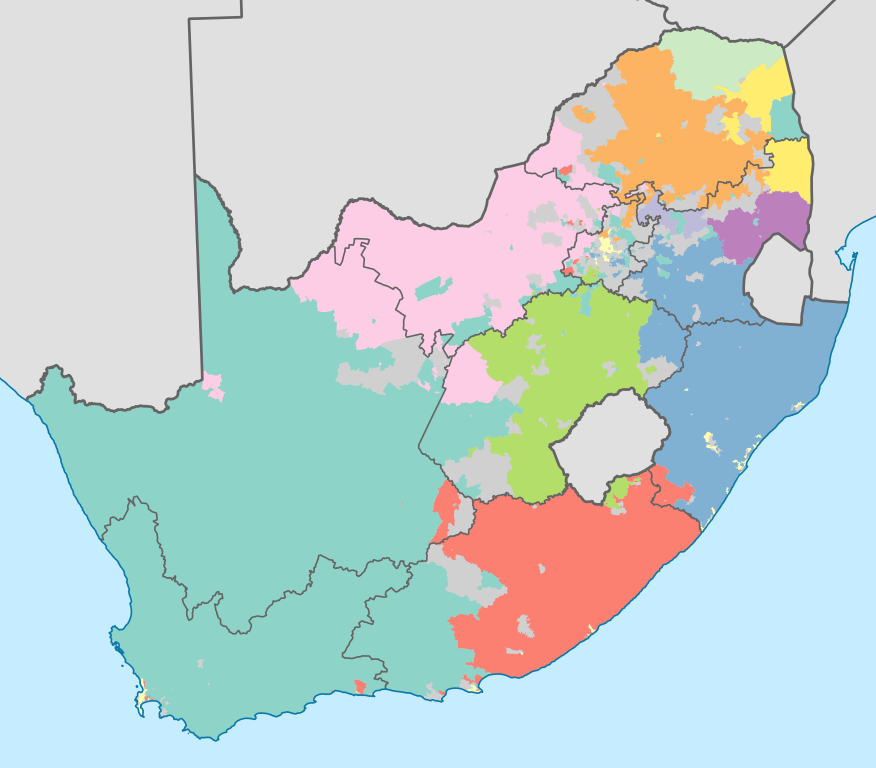
English: Map showing the dominant home languages in South Africa, based on ward-level data from the 2011 census. In this context, a language is dominant if it more than 50% of the population in a ward speak it at home, or more than 33% speak it and no other language is spoken by more than 25%.
English
Afrikaans
isiNdebele
isiXhosa
isiZulu
Sesotho sa Leboa
Sesotho
Setswana
siSwati
Tshivenda
Xitsonga
No language dominant
Projection is Albers Equal-Area Conic, with standard parallels at 25.5° S and 31.5° S, and origin at 28.5° S 24.5° E. |
| തീയതി | |
| സ്രോതസ്സ് | Statistics South Africa's Census 2011 is the source of the basic population data. The map results from my own processing of the data. For ward boundaries see File:South Africa electoral wards 2011 blank.svg. |
| സ്രഷ്ടാവ് | Htonl |
| മറ്റു പതിപ്പുകൾ |
South Africa 2011 dominant language map (hex cells).svg: .svg) |
അനുമതി
The following license applies to the population data on which the map is based:

|
ഈ പ്രമാണത്തിന്റെ പകർപ്പവകാശ ഉടമസ്ഥാവകാശം ഉള്ളയാളായ, Stats SA, പകർപ്പവകാശ ഉടമസ്ഥാവകാശമുള്ളയാളെ ശരിയായ വിധത്തിൽ പരാമർശിച്ചിരിക്കണം എന്ന നിബന്ധനയോടെ ഏതൊരുപയോഗത്തിനും ആരേയും അനുവദിച്ചിരിക്കുന്നു. പുനർവിതരണമോ, വ്യുൽപ്പന്ന സൃഷ്ടിയോ, വ്യാപാരോപയോഗമോ, മറ്റുപയോഗമോ സാദ്ധ്യമാണ്. |
കടപ്പാട്:
"the user acknowledges Stats SA as the source of the basic data wherever they process, apply, utilise, publish or distribute the data, and also that they specify that the relevant application and analysis (where applicable) result from their own processing of the data" [1]
|
The following tag applies to the map itself:
| ഈ സൃഷ്ടിയുടെ പകർപ്പവകാശ ഉടമയായ ഞാൻ, ഈ സൃഷ്ടി പൊതുസഞ്ചയത്തിൽ പ്രസിദ്ധീകരിച്ചിരിക്കുന്നു. ഇത് ആഗോള തലത്തിൽ ബാധകമാണ്. ചില രാജ്യങ്ങളിൽ ഇത് നിയമപ്രകാരം സാദ്ധ്യമല്ലെന്ന് വന്നേക്കാം; അങ്ങനെയെങ്കിൽ: ഈ സൃഷ്ടി, നിയമപ്രകാരം നിബന്ധനകൾ ഉണ്ടെങ്കിൽ അവയൊഴിച്ച്, യാതൊരു നിബന്ധനകളും ഇല്ലാതെ ഏതൊരാൾക്കും ഏതൊരു ഉപയോഗത്തിനും, ഉപയോഗപ്പെടുത്തുവാൻ ഞാൻ അനുവദിച്ചിരിക്കുന്നു. |
പ്രമാണ നാൾവഴി
ഏതെങ്കിലും തീയതി/സമയ കണ്ണിയിൽ ഞെക്കിയാൽ പ്രസ്തുതസമയത്ത് ഈ പ്രമാണം എങ്ങനെയായിരുന്നു എന്നു കാണാം.
| തീയതി/സമയം | ലഘുചിത്രം | അളവുകൾ | ഉപയോക്താവ് | അഭിപ്രായം | |
|---|---|---|---|---|---|
| നിലവിലുള്ളത് | 21:09, 18 നവംബർ 2012 | | 809 × 709 (798 കെ.ബി.) | Htonl | =={{int:filedesc}}== {{Information |Description={{en|1=Map showing the dominant home languages in South Africa, based on ward-level data from the 2011 census. In this context, a language is dominant if it more than 50% of the population in a ward speak... |
പ്രമാണത്തിന്റെ ഉപയോഗം
താഴെ കാണുന്ന 2 താളുകളിൽ ഈ ചിത്രം ഉപയോഗിക്കുന്നു:
പ്രമാണത്തിന്റെ ആഗോള ഉപയോഗം
താഴെ കൊടുത്തിരിക്കുന്ന മറ്റ് വിക്കികൾ ഈ പ്രമാണം ഉപയോഗിക്കുന്നു:
- af.wikipedia.org സംരംഭത്തിലെ ഉപയോഗം
- cs.wikipedia.org സംരംഭത്തിലെ ഉപയോഗം
- de.wikipedia.org സംരംഭത്തിലെ ഉപയോഗം
- dsb.wikipedia.org സംരംഭത്തിലെ ഉപയോഗം
- en.wikipedia.org സംരംഭത്തിലെ ഉപയോഗം
- eo.wikipedia.org സംരംഭത്തിലെ ഉപയോഗം
- frr.wikipedia.org സംരംഭത്തിലെ ഉപയോഗം
- fr.wikipedia.org സംരംഭത്തിലെ ഉപയോഗം
- fr.wiktionary.org സംരംഭത്തിലെ ഉപയോഗം
- he.wikipedia.org സംരംഭത്തിലെ ഉപയോഗം
- it.wikipedia.org സംരംഭത്തിലെ ഉപയോഗം
- ka.wikipedia.org സംരംഭത്തിലെ ഉപയോഗം
- ko.wikipedia.org സംരംഭത്തിലെ ഉപയോഗം
- lb.wikipedia.org സംരംഭത്തിലെ ഉപയോഗം
- mzn.wikipedia.org സംരംഭത്തിലെ ഉപയോഗം
- no.wikipedia.org സംരംഭത്തിലെ ഉപയോഗം
- pt.wikipedia.org സംരംഭത്തിലെ ഉപയോഗം
- rm.wikipedia.org സംരംഭത്തിലെ ഉപയോഗം
- ro.wikipedia.org സംരംഭത്തിലെ ഉപയോഗം
- ru.wikipedia.org സംരംഭത്തിലെ ഉപയോഗം
- sh.wikipedia.org സംരംഭത്തിലെ ഉപയോഗം
- simple.wikipedia.org സംരംഭത്തിലെ ഉപയോഗം
- sr.wikipedia.org സംരംഭത്തിലെ ഉപയോഗം
- ss.wikipedia.org സംരംഭത്തിലെ ഉപയോഗം
- sv.wikipedia.org സംരംഭത്തിലെ ഉപയോഗം
- sw.wikipedia.org സംരംഭത്തിലെ ഉപയോഗം
- szl.wikipedia.org സംരംഭത്തിലെ ഉപയോഗം
- te.wikipedia.org സംരംഭത്തിലെ ഉപയോഗം
- tg.wikipedia.org സംരംഭത്തിലെ ഉപയോഗം
- tr.wikipedia.org സംരംഭത്തിലെ ഉപയോഗം
- uk.wikipedia.org സംരംഭത്തിലെ ഉപയോഗം
- xh.wikipedia.org സംരംഭത്തിലെ ഉപയോഗം
- zh.wikipedia.org സംരംഭത്തിലെ ഉപയോഗം
- zu.wikipedia.org സംരംഭത്തിലെ ഉപയോഗം