പ്രമാണം:Lens and wavefronts.gif

Page contents not supported in other languages.
വിക്കിപീഡിയ, ഒരു സ്വതന്ത്ര വിജ്ഞാനകോശം.

Lens_and_wavefronts.gif(183 × 356 പിക്സൽ, പ്രമാണത്തിന്റെ വലിപ്പം: 35 കെ.ബി., മൈം തരം: image/gif, പുനരാവർത്തിതം, 9 ചട്ടങ്ങൾ, 0.7സെ)

slnglelens

ചുരുക്കം

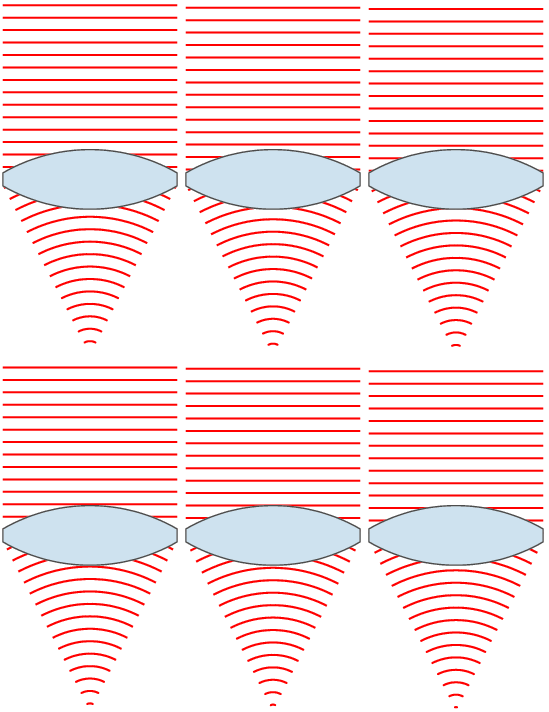
വിവരണം Illustration of wavefronts after passing through a lens. Interestingly, to produce a point source reverse the direction of the waves, with the focus point acting as a point source.
തീയതി (UTC)
സ്രോതസ്സ് self-made with MATLAB
സ്രഷ്ടാവ് Oleg Alexandrov
മറ്റു പതിപ്പുകൾ
 
ഈ GIF ഗ്രാഫിക് സൃഷ്ടിച്ചത് MATLAB ഉപയോഗിച്ചാണ്.

അനുമതി

Public domain ഈ സൃഷ്ടിയുടെ പകർപ്പവകാശ ഉടമയായ ഞാൻ, ഈ സൃഷ്ടി പൊതുസഞ്ചയത്തിൽ പ്രസിദ്ധീകരിച്ചിരിക്കുന്നു. ഇത് ആഗോള തലത്തിൽ ബാധകമാണ്.
ചില രാജ്യങ്ങളിൽ ഇത് നിയമപ്രകാരം സാദ്ധ്യമല്ലെന്ന് വന്നേക്കാം; അങ്ങനെയെങ്കിൽ:
ഈ സൃഷ്ടി, നിയമപ്രകാരം നിബന്ധനകൾ ഉണ്ടെങ്കിൽ അവയൊഴിച്ച്, യാതൊരു നിബന്ധനകളും ഇല്ലാതെ ഏതൊരാൾക്കും ഏതൊരു ഉപയോഗത്തിനും, ഉപയോഗപ്പെടുത്തുവാൻ ഞാൻ അനുവദിച്ചിരിക്കുന്നു.

siingleline

% Illustration of planar wavefronts going through a lens and getting focused
% into a converging spherical wave

function main ()

  % lens index
   n=1.5; 

  % number of points, used for plotting
   N = 100;

  % radii of lens surfaces
   R1 = 0.5; 
   R2 = 1.5;

  % centers of circles (y coord is 0)
   O1 = -2.9;
   O2 = -O1;

  % focal length
   f = (n-1)*(1/R1+1/R2); f = 1/f;
   
   % theta0 determines the width of the lens
   theta0=pi/6;
   Theta = linspace(-theta0, theta0, N);

  % right face of the lens
   L1x = R1*cos(Theta)+O1;
   L1y =R1*sin(Theta); 

   % left size of the lens
   L2x=-R2*cos(Theta)+O2;
   L2y = R2*sin(Theta);

   % flat top part
   Topx = [L1x(N), L2x(N)];
   Topy = [L1y(N), L2y(N)];

   % flat bottom part
   Botx = [L1x(1) L2x(1)];
   Boty = [L1y(1), L2y(1)];

   % the lens
   Lensx = [L1x rv_vec(Topx), rv_vec(L2x), Botx];
   Lensy = [L1y rv_vec(Topy), rv_vec(L2y), Boty];

   % Parameters for graphing
   Lens_color  = [204, 226, 239]/256;
   Lens_border = 0.3*[1, 1, 1];
   lbw = 1.3; % lens border width
   wavefr_color = [1, 0, 0];
   wavefr_bdw   = 2;
   
   % spacing between wavefronts (both plane and spherical ones)
   spacing = 0.25;

   % 2*H is the height of the plane wavefronts
   H = L1y(N); 

   % theta2 = slope of the line going from the upper-right
   % end of the lens to the focus point
   theta2 = atan(L1y(N)/(f-L1x(N)));

   % Shape of the spherical wavefronts.
   Theta = linspace(-theta2, theta2, N);
   X = -cos(Theta);
   Y =  sin(Theta);

   S = -f; % start ploting waves from here to the right

   % number of frames in the movie
   num_frames = 10;
   Shifts = linspace(0, spacing, num_frames+1);

   % start at S+shift, plot the wavefronts
   for frame_no = 1:num_frames

      shift = Shifts(frame_no);
      
      s = S+shift;

      % plotting window
      figure(1); clf; hold on; axis equal; axis off;

      % plot the plane wavefronts
      while s < 0
         plot([s, s], [-H, H], 'color', wavefr_color, 'linewidth', wavefr_bdw);
         s = s + spacing;
      end
      
   
      % plot the spherical wavefronts
      s = s - 10*spacing; % backtrack a bit
      while s < f
         
         rho = f-s;
         
         if rho*Y(N) <= L1y(N)
            plot(rho*X+f, rho*Y, 'color', wavefr_color, 'linewidth', wavefr_bdw);
         end
         
         s = s + spacing;
         
      end

      % plot the lens
      fill(Lensx, Lensy, Lens_color, 'EdgeColor', Lens_border, 'LineWidth', lbw);
%      get(H)
%      return
      
      % Invisible points to force MATLAB to keep the
      % plotting window fixed.
      tiny = 0.15*spacing;
      white = 0.999*[1, 1, 1];
      plot(S-tiny,   H+tiny, 'color', white);
      plot(S-tiny,  -H-tiny, 'color', white);
      plot(f+tiny,   H+tiny, 'color', white);
      plot(f+tiny,  -H-tiny, 'color', white);

      % Rotate by 90 degrees
      set(gca, 'View', [90, 90])

      % save current file
      frame_file = sprintf('Frame%d.eps', 1000+frame_no);
      disp(frame_file);
      saveas(gcf, frame_file, 'psc2');
      pause(0.07)
   end

% The frames were converted to a movie with the command
% convert -antialias -loop 10000  -delay 8 -compress LZW Frame100* Lens_and_wavefronts.gif
   
function W = rv_vec(V)

   K = length(V);

   W = V;
   for i=1:K
      W(i) = V(K-i+1);
   end

തലവാചകങ്ങൾ

ഈ പ്രമാണം എന്തിനെ പ്രതിനിധീകരിക്കുന്നുവെന്ന ഒറ്റവരി വിശദീകരണം ചേർക്കുക
Siingleline

ഈ പ്രമാണത്തിൽ ചിത്രീകരിച്ചിരിക്കുന്ന ഇനങ്ങൾ

സൃഷ്ടിയിലുള്ളത്

24 നവംബർ 2007

MIME type ഇംഗ്ലീഷ്

image/gif

പ്രമാണ നാൾവഴി

ഏതെങ്കിലും തീയതി/സമയ കണ്ണിയിൽ ഞെക്കിയാൽ പ്രസ്തുതസമയത്ത് ഈ പ്രമാണം എങ്ങനെയായിരുന്നു എന്നു കാണാം.

തീയതി/സമയംലഘുചിത്രംഅളവുകൾഉപയോക്താവ്അഭിപ്രായം
നിലവിലുള്ളത്06:35, 25 നവംബർ 200706:35, 25 നവംബർ 2007-ലെ പതിപ്പിന്റെ ലഘുചിത്രം183 × 356 (35 കെ.ബി.)Oleg Alexandrovtweak
04:10, 24 നവംബർ 200704:10, 24 നവംബർ 2007-ലെ പതിപ്പിന്റെ ലഘുചിത്രം171 × 356 (33 കെ.ബി.)Oleg Alexandrovtweak
04:09, 24 നവംബർ 200704:09, 24 നവംബർ 2007-ലെ പതിപ്പിന്റെ ലഘുചിത്രം171 × 356 (33 കെ.ബി.)Oleg Alexandrovtweak
00:56, 24 നവംബർ 200700:56, 24 നവംബർ 2007-ലെ പതിപ്പിന്റെ ലഘുചിത്രം171 × 359 (33 കെ.ബി.)Oleg Alexandrovtweak, same license
00:53, 24 നവംബർ 200700:53, 24 നവംബർ 2007-ലെ പതിപ്പിന്റെ ലഘുചിത്രം171 × 359 (32 കെ.ബി.)Oleg Alexandrovtweak
00:49, 24 നവംബർ 200700:49, 24 നവംബർ 2007-ലെ പതിപ്പിന്റെ ലഘുചിത്രം151 × 359 (31 കെ.ബി.)Oleg Alexandrov{{Information |Description=Illustration of wavefronts after passing through a [:en:lens (optics)|lens]] |Source=self-made with MATLAB |Date=~~~~~ |Author= Oleg Alexandrov |Permission=see below |other_versions= }}

താഴെ കാണുന്ന താളിൽ ഈ ചിത്രം ഉപയോഗിക്കുന്നു:

പ്രമാണത്തിന്റെ ആഗോള ഉപയോഗം

താഴെ കൊടുത്തിരിക്കുന്ന മറ്റ് വിക്കികൾ ഈ പ്രമാണം ഉപയോഗിക്കുന്നു:

ഈ പ്രമാണത്തിന്റെ കൂടുതൽ ആഗോള ഉപയോഗം കാണുക.

"https://ml.wikipedia.org/wiki/പ്രമാണം:Lens_and_wavefronts.gif" എന്ന താളിൽനിന്ന് ശേഖരിച്ചത്